The process Life Cycle (analyticals)
Combining several concepts to a new complete circular one
Analytical Life Cycle, Proces Life Cycle

A cyle goes around, clockwise counterclockwise.
A windwill goes counterclockwise. For convenience the proces life cycle is clockwise
🔰 the most logical
begin anchor.
Contents
| Reference | Topic | Squad |
| Intro | Analytical Life Cycle, Proces Life Cycle | 01.01 |
| Issues | Issues to solve at Analtics life cycle | 02.01 |
| add-aim | Information source AIM | 03.01 |
| add-pdca | Information source adding PDCA | 04.01 |
| add-crisp | Adding Information source Crisp-dm | 05.01 |
| result-ALC | Resulting infographic ALC | 06.01 |
| | | --.-- |
| wall-cnfs | Wall of confusion | 07.01 |
| get-data | Getting Data - ICT Operations | 08.01 |
| get-tools | Requesting tools - ICT Operations | 09.01 |
| opr-monitor | Adding Operations - monitoring | 10.01 |
| score-monitor | Adding Scoring results - monitoring | 11.01 |
| review | Evaluation , DLC Development Life Cycle | 12.01 |
Progress
- 2019 week:15
- Started fresh, collecting pictures made more than a year ago.
- Caught by needing links to previous and coming details at wall-cnfs.
- Although it is one topic there are two story lines, a split in the middle.
- 2019 week:15
- Finished adding some new pictures explaining focus monitoring.
Issues to solve at Analtics life cycle
The devlopment proces of a "machine learning" proces has been invented separated from Business processes and separated from ICT.
The used words are different. One of the oldest an best frameworks is crisp-dm.
For information on data science a good site is "kdnuggets".
The assocation is getting gold from "knowledge discovery in databases" process, or KDD.
Searching for crisp-dm challenges and data science.
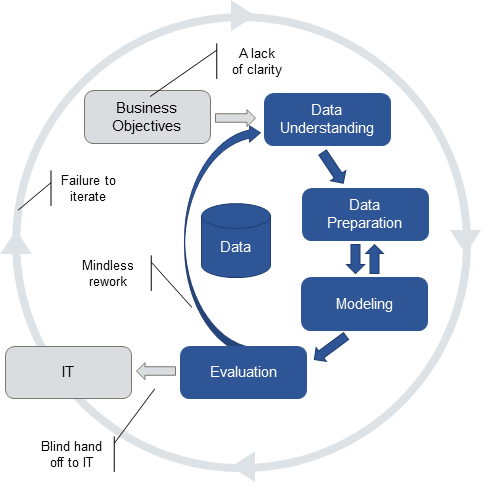
The crisp-dm proces is felt problematic: 👓
fail crisp-dm -1- or
fail crisp-dm -2- .
Missing or neglected or otherwise going bad are the connections to business and ICT.
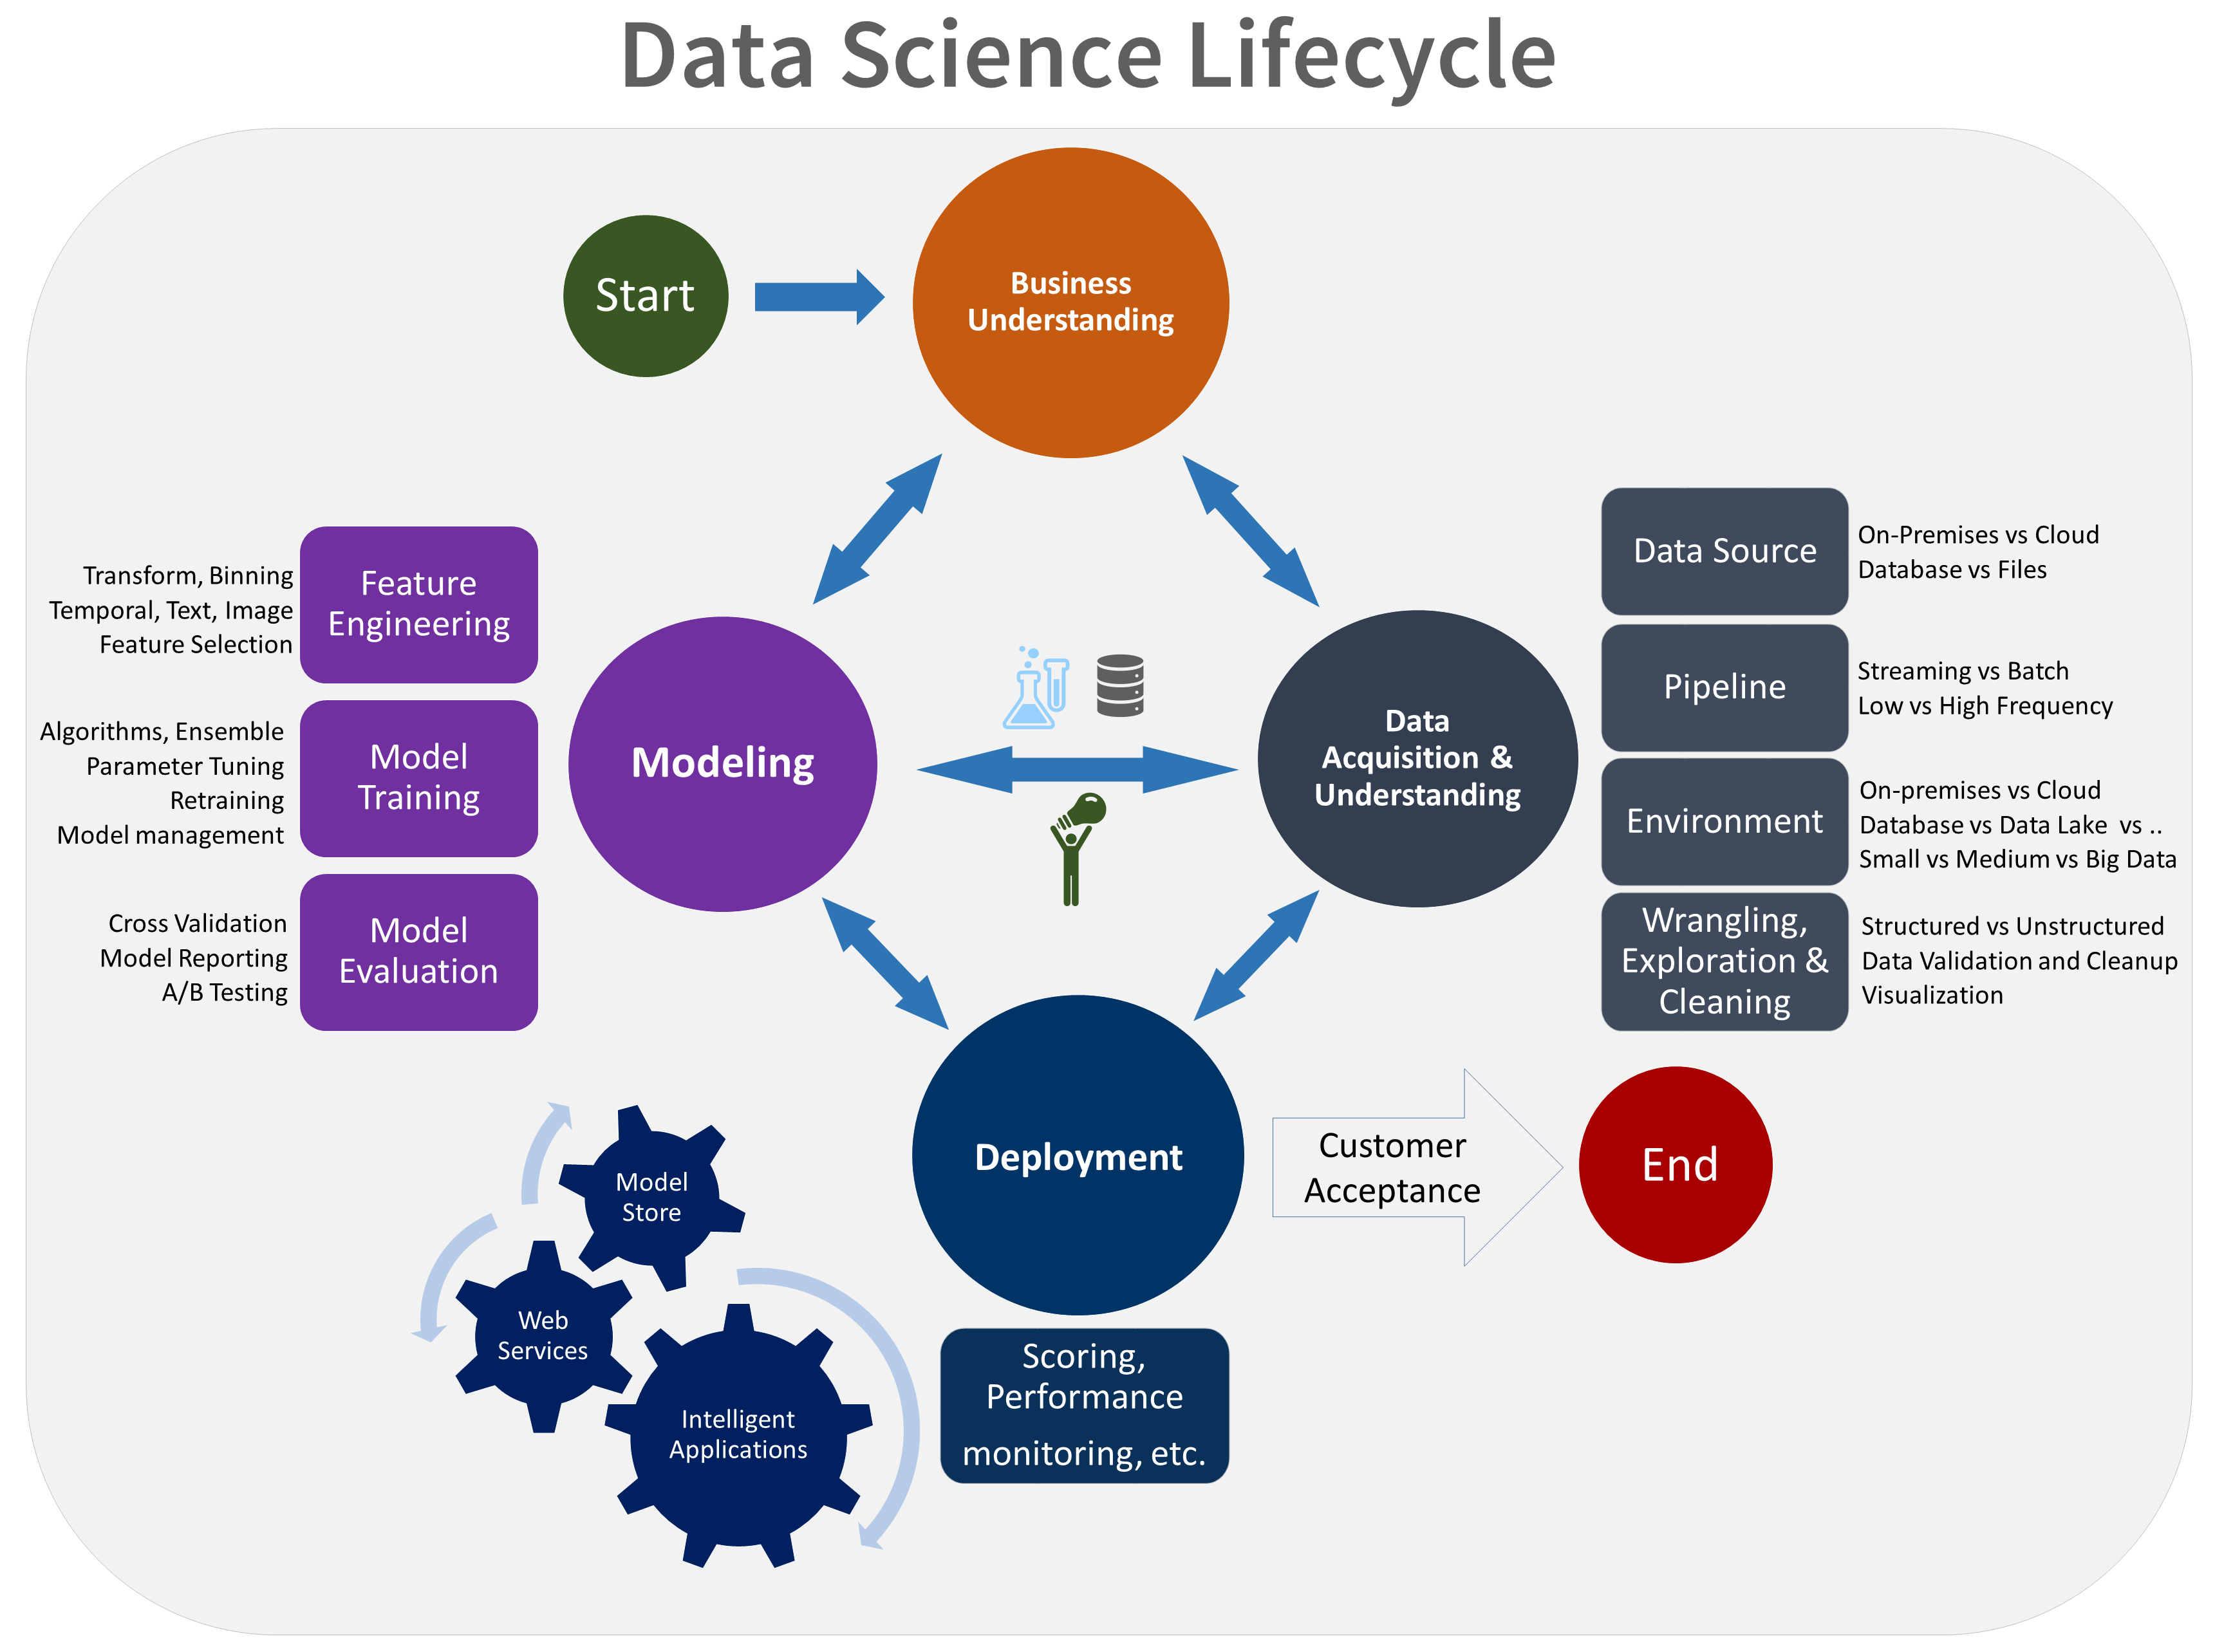
Microsoft has bought "Revoltion Analytics" and is going for an important at Analytics and BI.
Their approach is like this figure aside. (👓)
Although they are using the same step as Crisp_dm, it is not circular. It is business request without the PDCA cycle, there is start (charge) and end (delivery).
The ICT deployment is mentioned, needed for a delivery, but not detailed.
Nice are the statements on the data pipeline and monitoring:
In this stage, you develop a solution architecture of the data pipeline. You develop the pipeline in parallel with the next stage of the data science project. Depending on your business needs and the constraints of your existing systems
-//- ,
-//-
It is a best practice to build telemetry and monitoring into the production model and the data pipeline that you deploy. This practice helps with subsequent system status reporting and troubleshooting.
Information source AIM
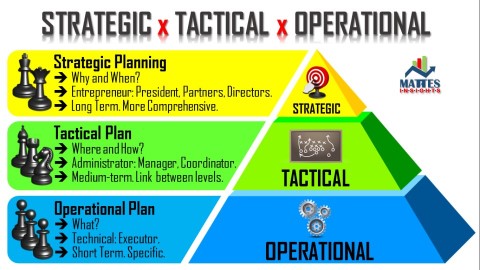
The hierachical top down communcation line is a pyramid. There are many departments doing a part of the job.
The tactical level is also there for guidelines and compliancy with legal requirements.
Placing the data, information, in the middle the legal requirements aside the data a circle for running processes can by made clockwise.
A figure is like:
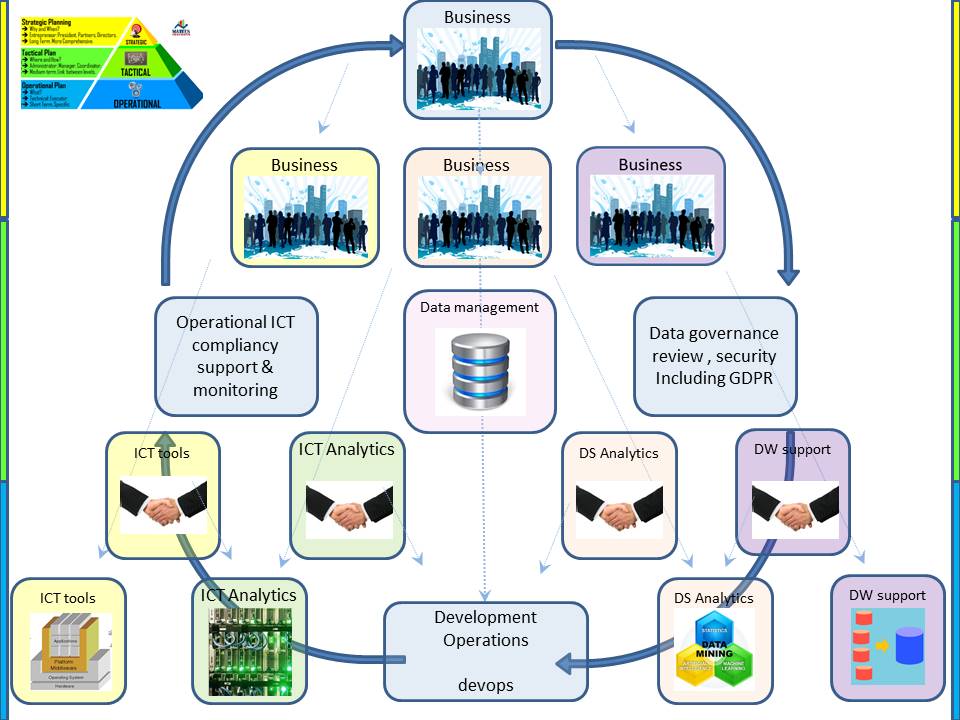
The requests from business perspective at the right side going down to the operational area. The operation ICT delivering the service at the left side.
At the bottom there is curious connection where business requests having developed and ICT realization are coming together under supervison of business control.
Of many departments involved in a data driven environment (bottom left to right):
- Delivering ICT infrastructure Network, Servers (hardware), Desktops (hardware), Operating Systems (software), Storage, Security, all tools like BI - and Analytical (software)
=ICT-Tools=
- Getting the business software aligned according to their goals using the available Infra, changing those configurations helping at alignments.
=ICT-Analytics= ⚙
- Programming, analyzing the data, proposals for better business decisions.
=DS Analtyics= 🎭
- Managing the data commonly using a DBMS with a roles of the DBA, DataBase Administrator. Using NoSQL, more simple or more complicated: Hadoop, Cloud.
=DW Support
There can be much more than these mentioned depatments.
These four are the ones essential in an Analytics Proces Life Cycle.
Some of those departments have a direct shared control, others only by going up the whole hierarchy up and than going back.
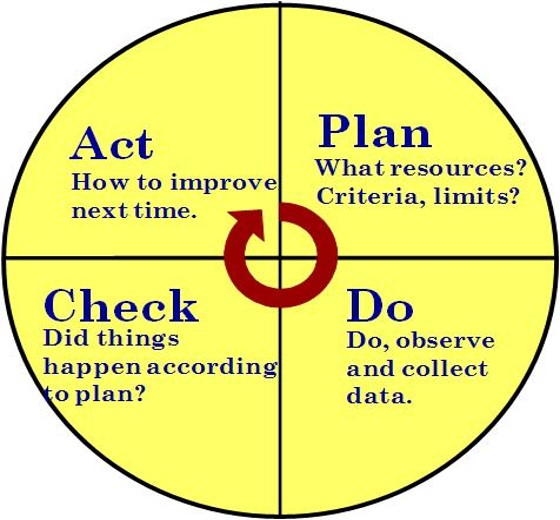
Information source adding PDCA
The PDCA cyclus is a standard approach. With DMAIC (Lean Six Sigma) there is an additional control step after an improvement to prevent falling back in old problems.
I use small colored circles in the picture for every involved party doing their work. It covers planning, deadlines with changes.
There are multiple PDCA cycles. One for the overall process and three others for every direct involved party.
The picture is getting too crowded, cleaning up the departments that are necessary in the holostic cycle but NOT within the continously improvement of the business proces.
Improvements doing the own work of the shown departments should also be included in the continously improvements.
The figure transforms into:
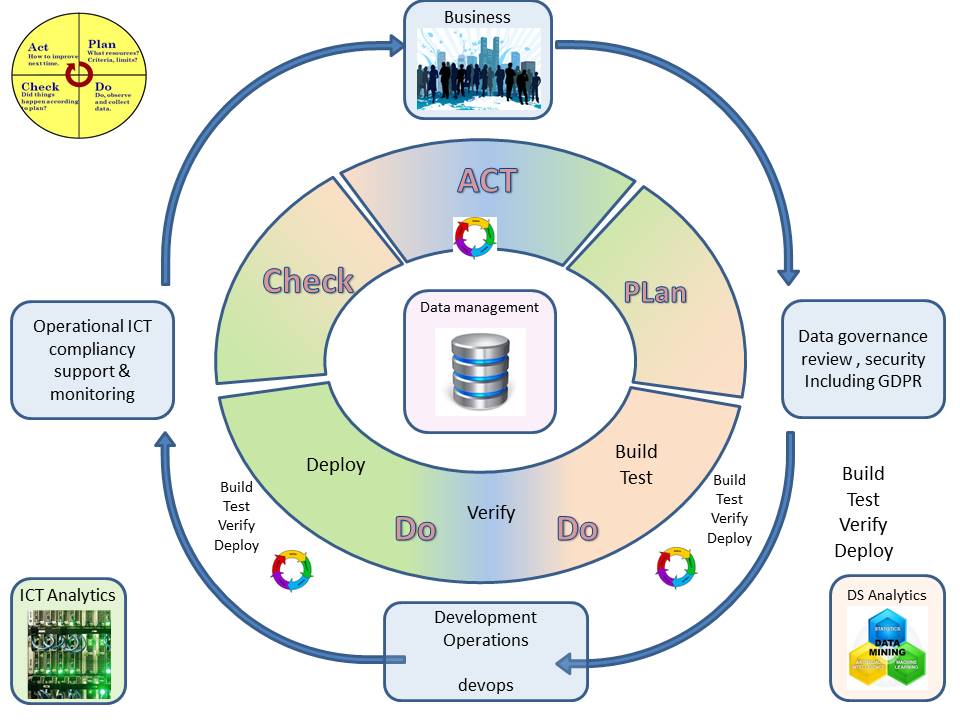
Modifications on the AIM hierachy:
- Tactical representation (blue) moved outwards, making room for inner circle .
- A full big PDCA colored circle having the "DO "at the bottom (operational) is added with three smaller ones.
- The diagonal green and orange lines are departmental involvments.
Preparation of data is done with the help of =ICT Analytics= ⚙
Monitoring of scores needs the help of =DS Analytics= 🎭
The visible lines:
- Business with four representations in the vertical and horizontal crosshair lines (blue), The one in the bottom is lacking a clear definiton being a tempory role.
- =ICT Analtyics= ⚙ having two representations, a duality from a single department, in the diagonal: bottom-left , top-right (green)
- =DS Analtyics= 🎭 having two representations, a duality from a single department, in the diagonal: bottom-right , top-left. (orange)
=ICT Analtyics= ⚙ and =DS Analtyics= 🎭 are both having different tasks at each of their corners, depending on all the others being involved.
When doing work without any ainteractions the focus for each is getting the agreed work getting done within deadlines.
Adding Information source Crisp-dm
Presidon crisp-dm is showing this more advanced picture. It is in 2020 part of Version1.
crisp-dm history (wikipedia) Cross-industry standard process for data mining
The crisp-dm document is owned now by:
IBM SPSS
It is having "monitoring" after deployment.
Presidion, formerly SPSS Ireland, was set up in Dublin as a regional office of SPSS UK in 1994 to be the main partner office in Ireland.
The deployment setup in a similar figure as ML modelling is not mentioned before.

Is used at:
👓
Machine supported develop Change ML AI.
Details to be found at:
👓
Release management SDLC - release management.
The picture is getting too crowded, cleaning up that big PDCA circle in the middle. It was temporary, a circle still being there.
The figure transforms into:
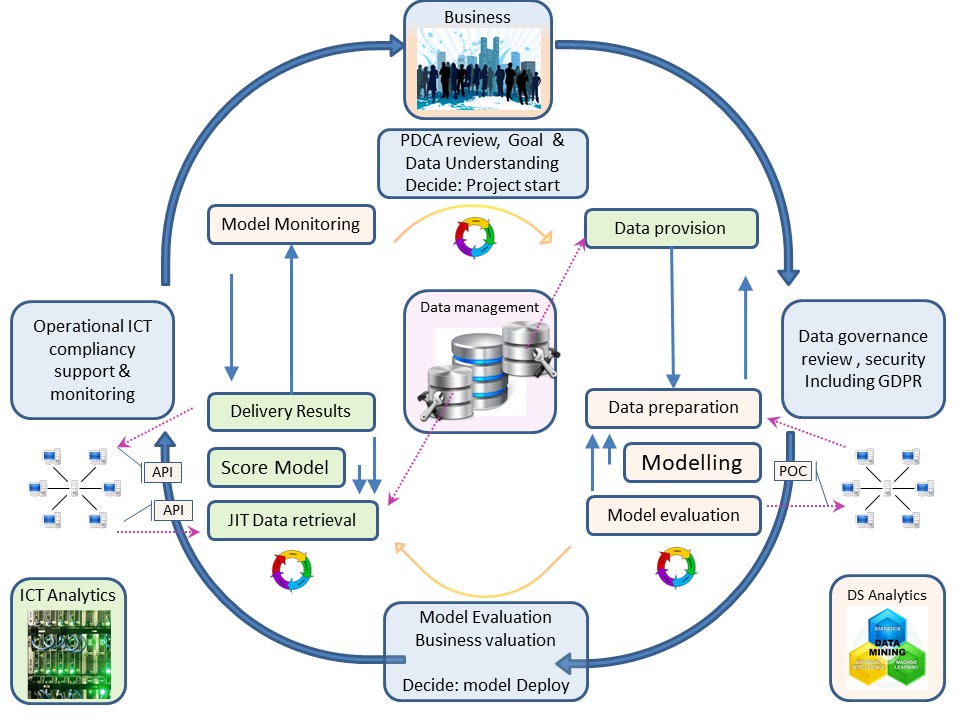
Modifications on the AIM + PDCA:
- All crisp-dm stages 🎭 added at the ML devlopment ara (right side).
- The deployment ⚙ in a split up with model monitoring added (left side).
- External connections (streaming, api, poc) added at modelling and scoring
- Multiple data pipelines (dev - ops) because different set of policy requirements although they are logical / technical similar.
Resulting infographic ALC
A static picture is not representative, there is change in time and in activities, transformations. A moving circle with four stages:
- 🕛 Business Understanding, data understanding
- DS 🎭 Determing * or 0 status. Ideas: improvements opportunities.
- BU 📚 Business goals targets, budgets, mandate.
- IT ⚙ Information availability, options to add for new ideas.
- 🕒 Data understanding preparation, modelling, model evaluation
- IT ⚙ Data provision. (dependicy on others)
- BU 📚 ⚖ Verifying correctness policies legality data in proposals.
- DS 🎭 Data preparation, modelling, model evaluation (DTA-).
- 🕕 Deployment model - user acceptance
- DS 🎭 Deliver code,realease information, expected model behavior
- BU 📚 ⚖ Verify expected model behavior, decide to deploy yes/no.
- IT ⚙ Retrieve delivered code, put them using DTAP in a release.
- 🕘 Model scoring - delivery, model monitoring
- IT ⚙ Running scoring, making monitoring results available (-TAP).
- BU 📚 ⚖ Verify processing is according policies and legal (law).
- DS 🎭 Evaluate monitores scores and results on coorect behavior.
Not mentioned is the underpinning on the algoithm (scoring) and its behavior.
Impact for wrong results should have an alnternative reviewing proces that can give another outcome is to be considered. The decision of that alternative to be described, well documented.
Change using information.
Wall of confusion
The holistic ICT environment is very comlicated by all interactions and fast technical changes.
The conflict of development innovations and stable operations is told many times.
another TCT service story SukumarNayak (2015)

That picture isn three is telling a lot.
The ideal cyclic proces is clear, but there is no ideal world. There are threats.
To understand those backgrounds more information is on other pages.

Is used at:
..
Details to be found at:
👓
innovation X stable operations hiearchical segregation.
👓
Machine supported develop Change ML AI.
👓
Release management SDLC - release management.
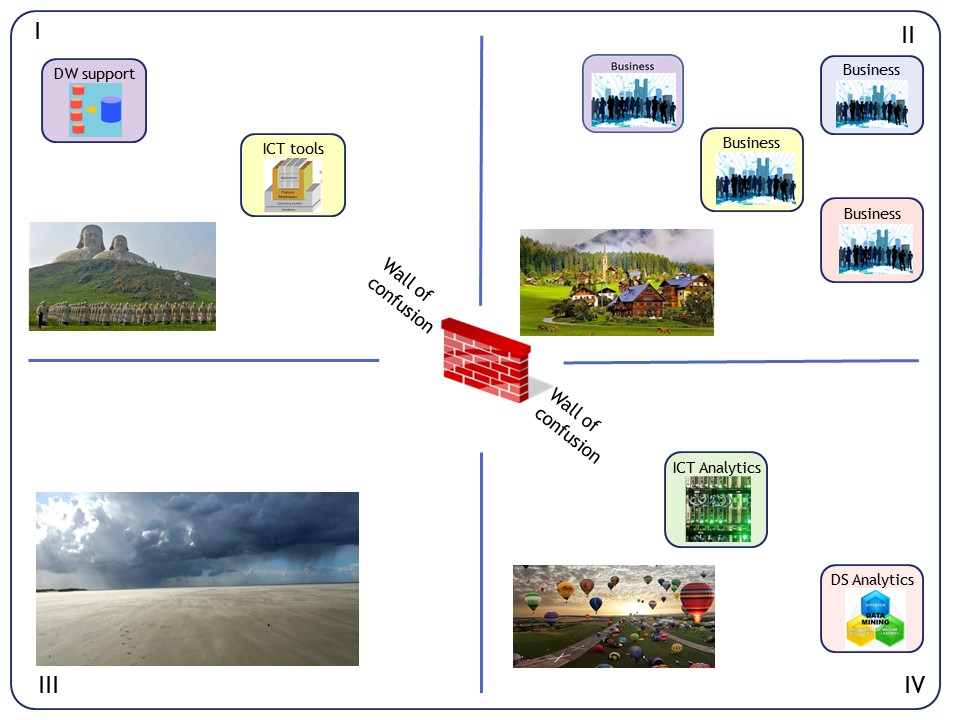
The wall of confusion is in the deeping of quadrants.
Different attitides, big distances and clockwise push counterclockwise pull movements.
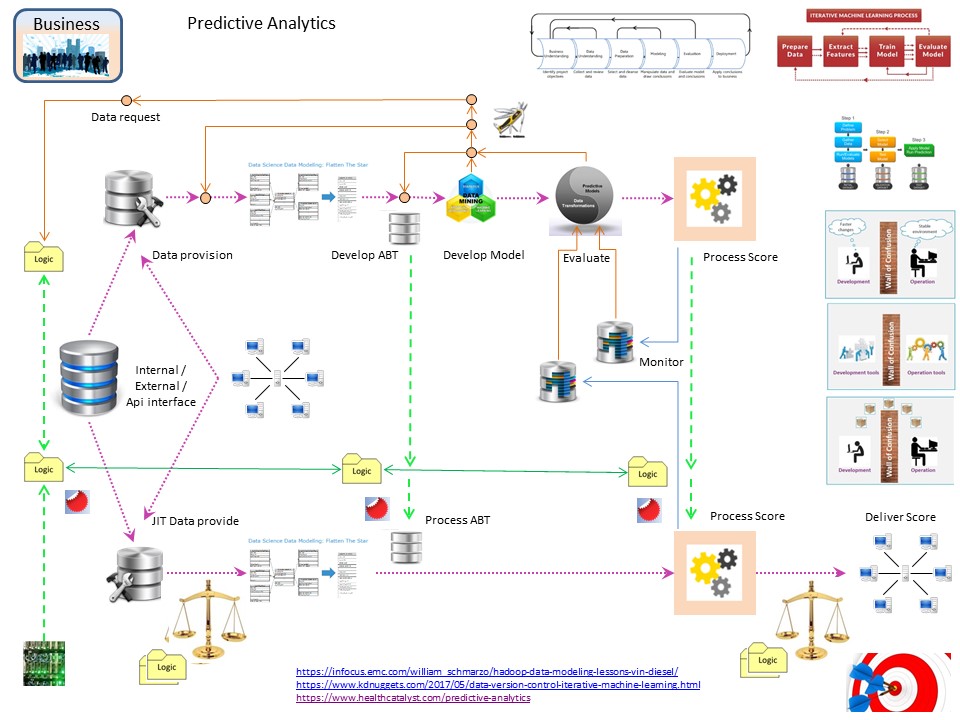
Within the SDLC proces there are several lines to focus on:
- Dev data delivery (input) ✅
- Development model proces ✅
- Opr data delivery (input) ⚠
- Opr scoring proces ⚠
- Opr data delivery (output) ❓
- Dev/Opr results, monitoring & evaluation ❌
The line of operational activity is needing more attention.
The activity of monitoring on the results in the operations needed as ieteration feedback is needing more attenion.
Getting Data - ICT Operations
Solving request for more data sources will involve more parties.
In this case =DW support= managing data central using DBMS systems.
A clear proces having a single direct line in control is lacking.
A direct request from =DS Analytics= to =DW support= is neglecting =ICT Analytics=
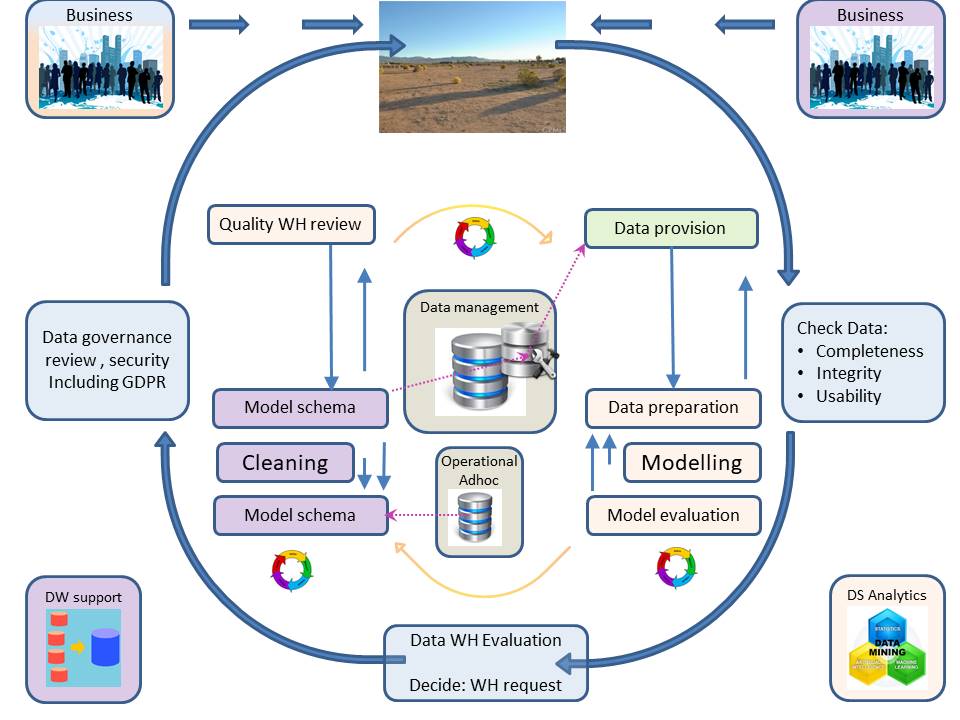
Pitfalls:
- Bad performance or even unworkable operationable processings.
- Not being aligned with business properties and legal requirements.
- Not suited for future changes by a technology lock-in.
A direct request from =ICT Analytics= to =DW support= is neglecting =DS Analytics=
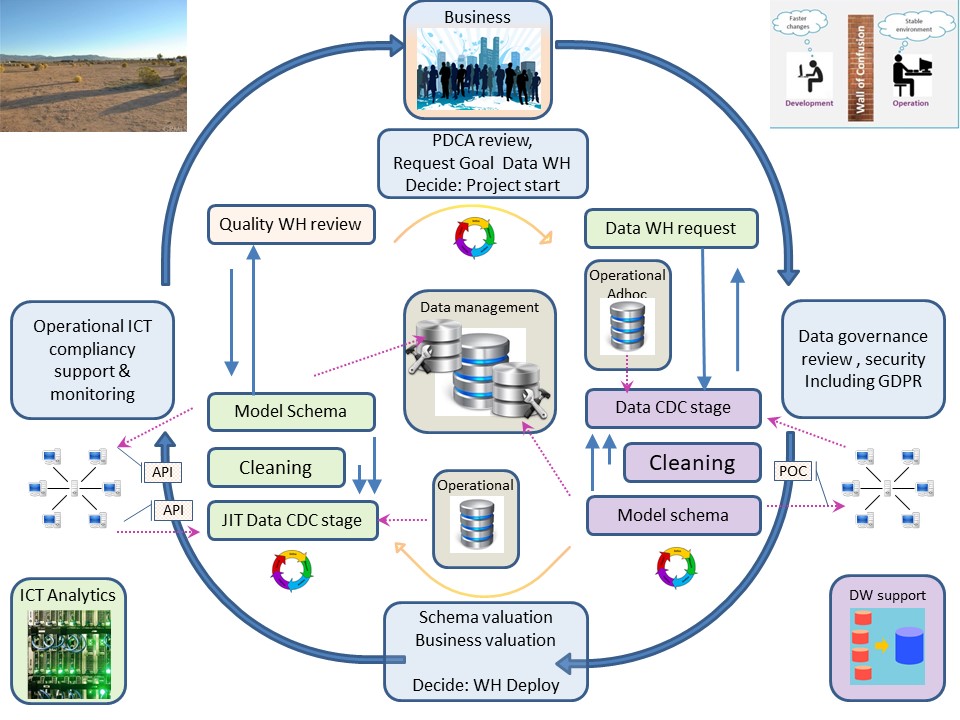
Pitfalls:
- Wrong data being retreived or not in state being expected.
- Timing of delivery data might not as needed. Model building and scoring have differences in requirements.
Requesting tools - ICT Operations
Solving request for more data sources will involve more parties.
In this case =ICT Tools= managing servers and "the applications" (tools).
A clear proces having a single direct line in control is lacking.
A direct request from =ICT Analytics= to =ICT tools= is neglecting =DS Analytics=
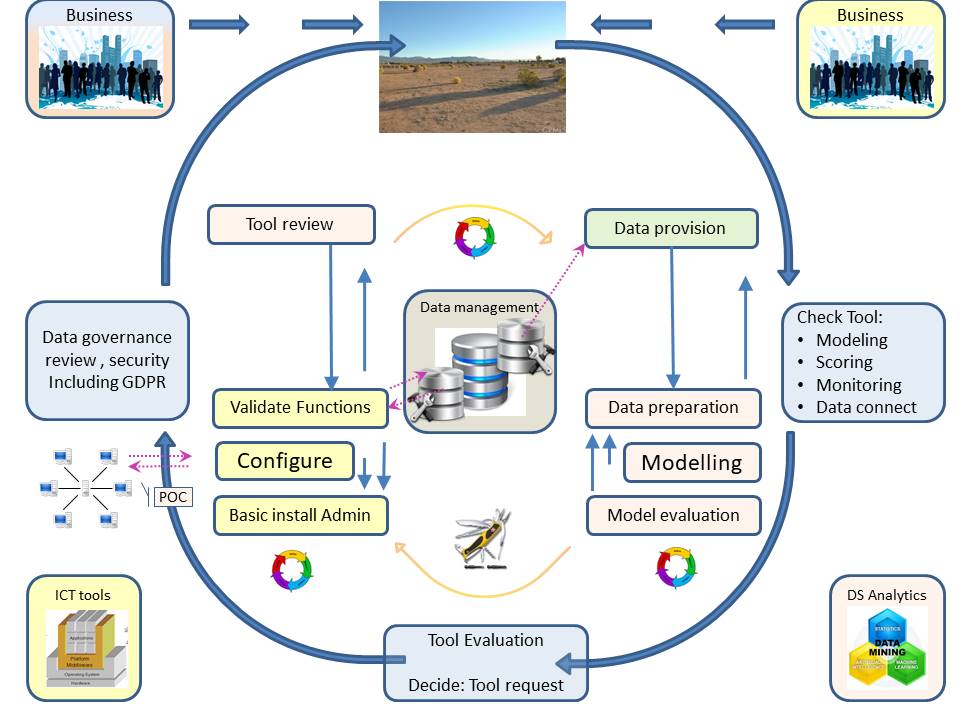
Pitfalls:
- Unnecessary steps by crossing machine layers causing difficulties in data representation (encoding transcoding).
Even not able to proces what has developed operationally.
- An one-off once analyse report dashboard is different to one that should be embbeded into to business operations.
- Not being aligned with generic business policies (eg security) and legal requirements.
- Not suited for future changes by a technology lock-in.
A direct request from =DS Analytics= to =ICT tools= is neglecting =ICT Analytics=
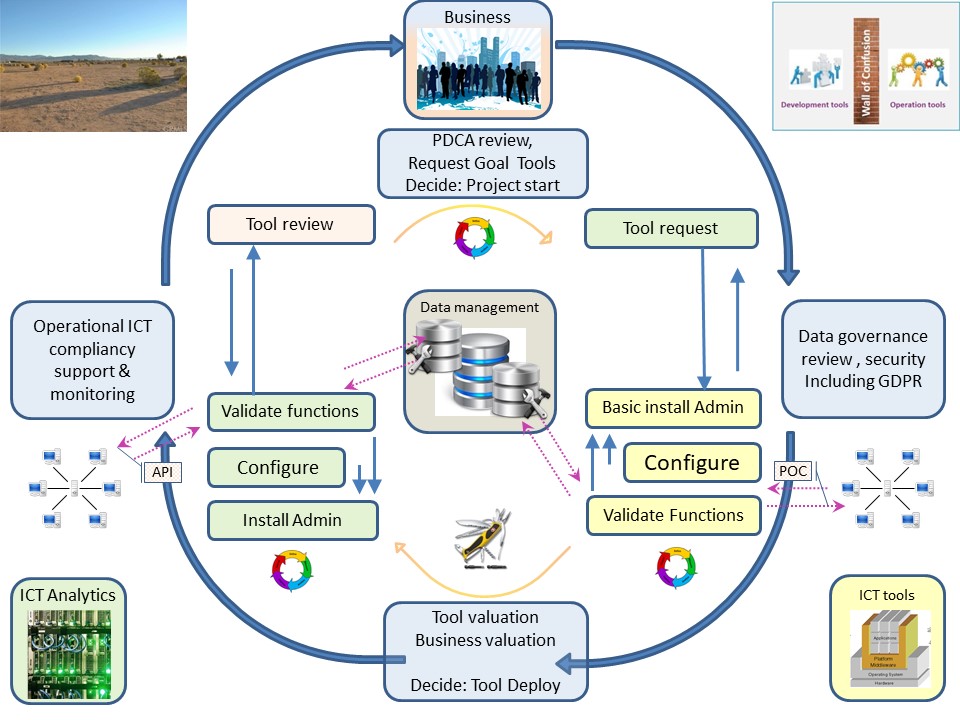
Pitfalls:
- The requested state of the art tools as expectation in mismatch.
- The delivery getting blocked for not clear reasons.
Adding Operations - monitoring
The full crowded picture "SDLC analytics" without the DTAP is like:

Explanations:
- The vertical dashed green lines are the release of versios to be coördinated. There are three of them, not relevant here.
- The data delivery for model building the transform to a DNF (DeNormalized File), ABT(Analytical Base Table) and modelling, not relevant here.
- Notes arround, links referring used sources, not relevant here.
The operational pipeline has four dashed pink lines.
The picture in focus is like:
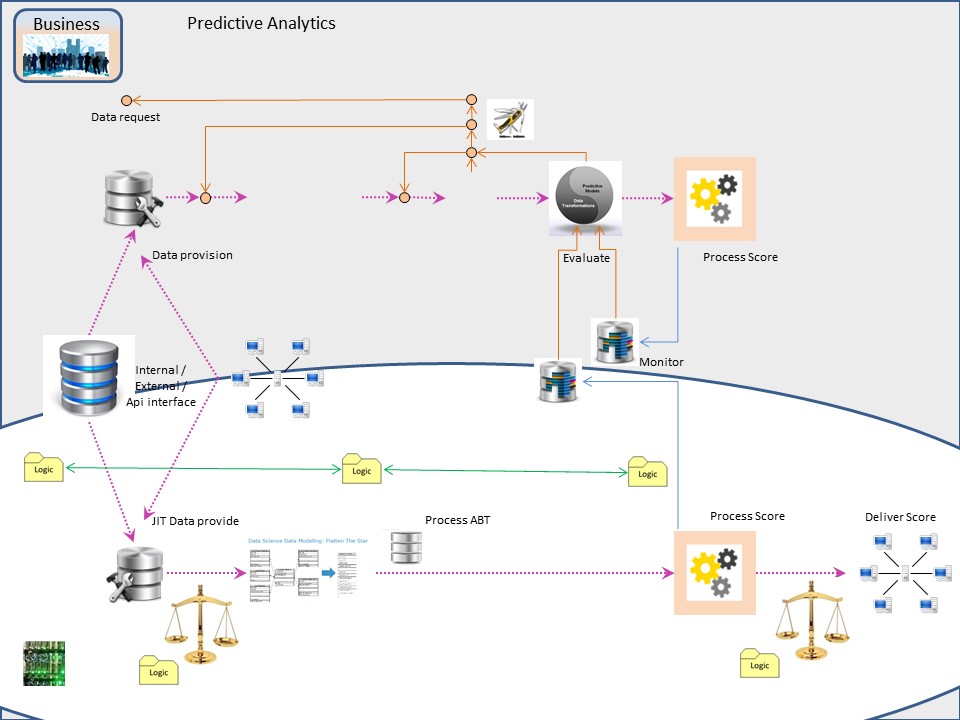
Watch Dog - Operational Monitoring:
- The first stage is verifying the retrieved data is consistent enough to proceed. Every segregated table can grow and shrink, the speed of change shoud be within expected margings
- If possible a full update is the most reliable in synchronisation information. At that moment a best technically tuned version is easily done.
The mutations when appropiate are able to profit from that tuned version. Degradation in performance can be expected when many updates are applied.
- When there has nothing being logically changed, a scoring proces running on selected updates should not crash.
- When doing a score on the total populations regulary, the scoring results should in changed numbers variations are monitored.
The variation in changes shoulfall within expected ranges. When there is something unexpected score deliveries should be halted until someone a review for the cause has done.
Adding Scoring results - monitoring
The scoring monitoring has two blue lines and two storage containers that are usually labled as "nasty unknown" getting them "out of scope" by business.
Knowing what is happening with scores might be very important information.
An unstable profiling result will cause legal problems when that is discovered by external complaints.
For the business analyst, data scientist it is important to be able to analyze prodcution score results without having a conection into that process possible harming it.
The picture in focus is like:
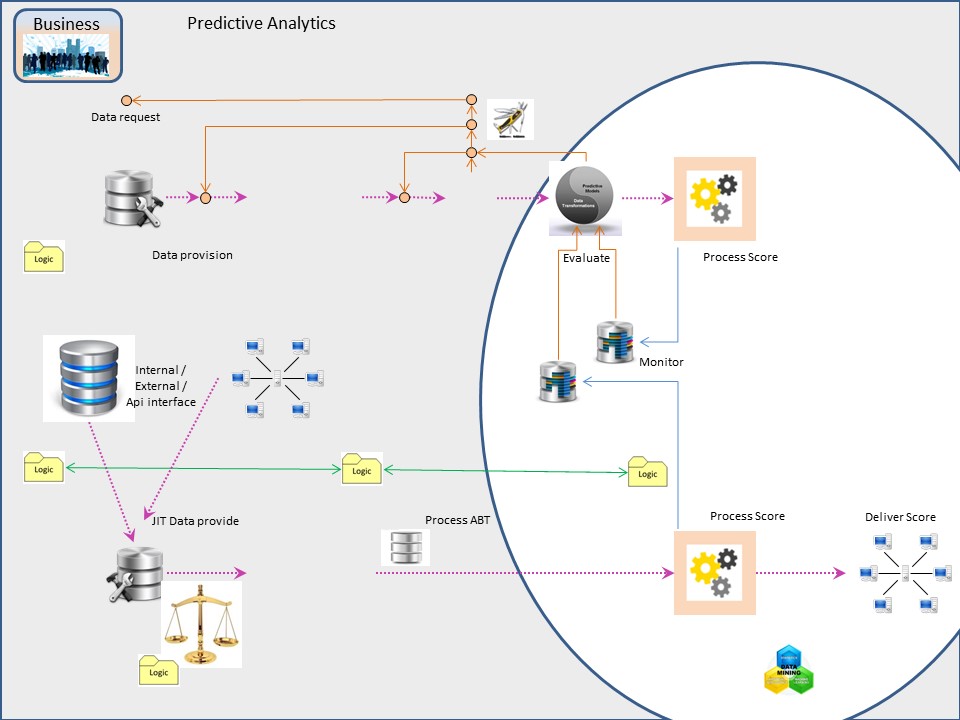
Attention points Score monitoring:
- Scoring results are best stored incremental with time marks and scoring model version indication.
- The incremtnal storing has an question to solve, that is: what is the scoring moment on any moment even when no scores were changed.
- The needed segregation in machines servers tgWhen there has nothing being logically changed, a scoring proces running on selected updates should not crash.
- When doing a score on the total populations regulary, the scoring results should in changed numbers variations are monitored.
The variation in changes shoulfall within expected ranges. When there is something unexpected score deliveries should be halted until someone a review for the cause has done.
Evaluation , DLC Development Life Cycle
Reviewing the resulting cycle again.
Would it really be different using old 3-gl tools like Cobol, JCL and more. Doing the business analyses by businesse analists instead of data scientists?
I am not seeing any big differnces when using this Life Cycle approach. Only technical details and used words can be different.
🔰 the most logical
begin anchor.
 A cyle goes around, clockwise counterclockwise.


