rslt OPS = Value stream, removing constraints
Data modelling, process scheduling.
Defining work of users & colleagues easier.

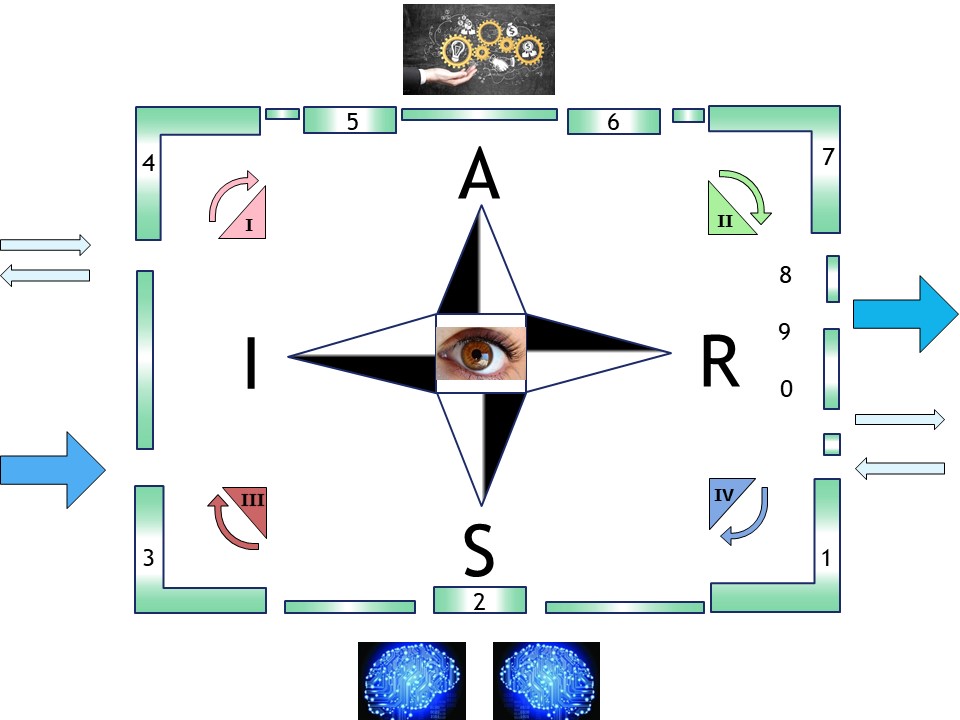
Working experiences by some controls. The SIAR cycle is there using the corners 👓, topic cycle in the center.
SIAR:
S Situation
I Initiatives
A Actions
R Realisations
🔰 lost here, than..
devops sdlc.
Progress
- 2020 week:12
- Deltails line filled.
- Filled with the sprints moments done at some projects over all years.
- The controls as counterpart of this page: done before this one.
- 2020 week:11
- The cotrol flow, counterpart of this page is done
- Starting add technical details explaining the choices that are made.
Contents

Understanding the system CSI not Crime Scan Investigation although the difference would be minor when there is a cyber crime to investigate.
Anything that can be observed is potential important. There are many overlapping operational tasks. Availability of systems is one of those.
Soc, Security operations Center and Computer Operations.
SoC in a very simplified approach only having that interface of security access.
System management facilities (SMF) collects and records system and job-related information that your installation can use in:
- Billing users
- Reporting reliability
- Analyzing the configuration
- Scheduling jobs
- Summarizing direct access volume activity
- Evaluating data set activity
- Profiling system resource use
- Maintaining system security
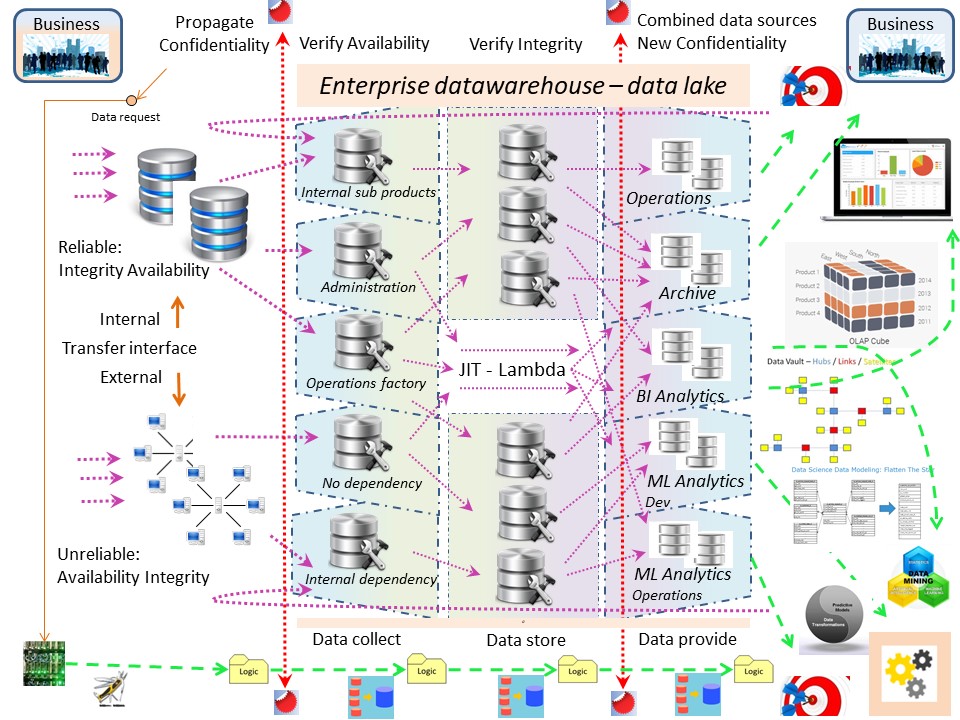
That are a lot of goals with a different kind of usage. ETL, DWH, in a figure:
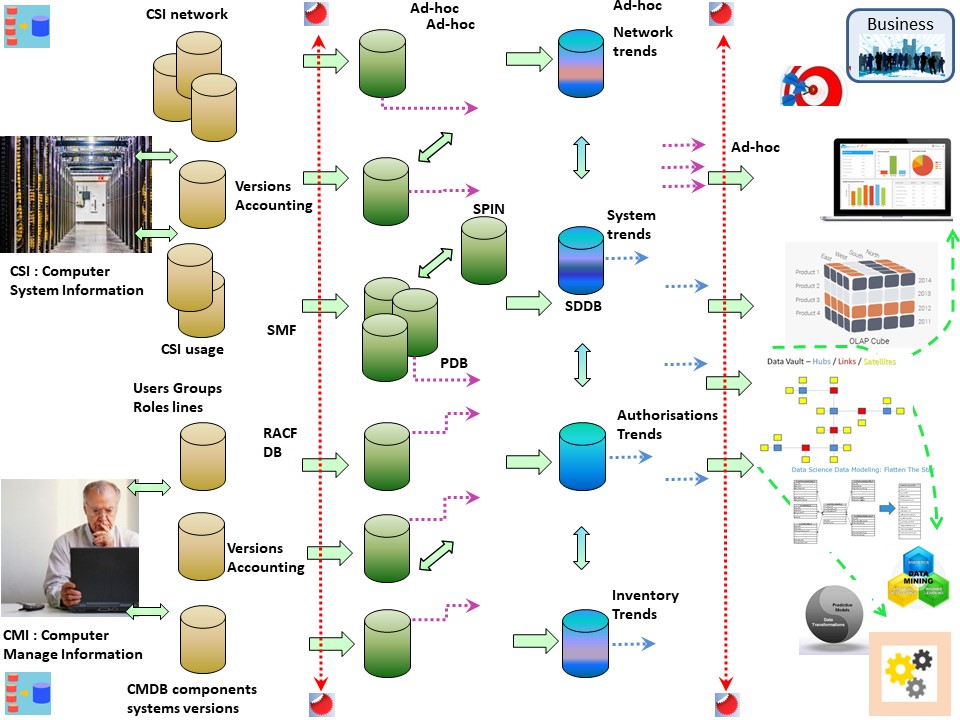
Add data for:
- Network, firewalls
- System information by retrieving and administration.
- User group authoristions with accounting information.
- Business applications with owners and accounting information.
The data lake for Computer System Information (CSI) is able to support security opeerations and others. It started wiht those others.
Having a generic system (SMF) avoids the need for defining a data pipeline for every subsystem.
System Trend database.
💡 In this approach the SDDB´s are database collecting summarized history updated by increments in time.
This saves storage, anonymizes the data, makes retention policies for detailed information realistic implementable.
The only disadvantage is that when a new or changed trend analyses is defined it has to rebuild from what is available.

The big data, AI, ML Machine learning, is getting a lot of attention by the new way of business rules, modelling.
The practicial operational how to run processes neglegected. New requirements on how the model is explainable used and what the model does in operations are being ignored.
Running predictable planned processes ⚙
Planning an operational process is dictated by agreed interfaces.
Those interfaces are decoupling responsibilities needing both actions on what is te goal when all goes as intended and what when one of the deadlines in interfaces by any party is missed.
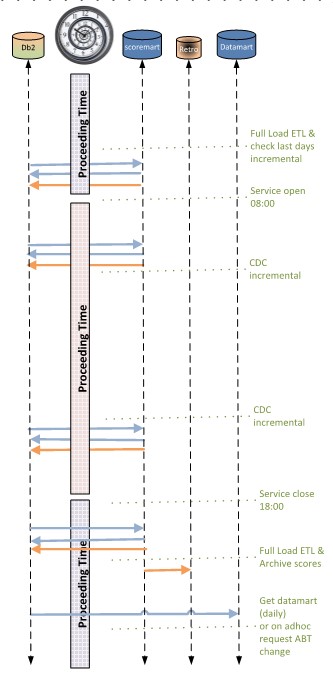
The scheduling:
- Getting the daily updates new expected cases, run before office hours.
Correction restart normal before lunch end.
- Processing manual updates on what was delivered in the last run. New scores to generate archive and give a feed back on those manual updates.
Correction restart before lunch end.
- The main scoring process starting after 15:00u when a file is available. Delivery signals in a file for that main process before 17:00.
- Delivering related other signals should correctly finish before 21:00 and before 07:00 next day.
- Once a week full update before office hours.
Correction restart normal before lunch end.
Only when the full update is correct finished it will replace the previous version.
This setup is the basic design of the model deployment. Fine tuning details, changing models, changing data, is the daily improvement activity.
Conditions using scheduling 🎭
Scheduling is done in a very basic way. There are many technical options. With the first four, most of what is wanted can be automated.
- moment in time. This one anybody knows.
- CC Condition Code of another program.
- Existence yes/no of some file.
- Calendar functionality for repeating flows.
- Some Database event (not generic).
- Load on system resources.
- Agreed moment a process has to be ready.
The Condition Code logic is a basic coding instruction. It is instructing developers to set this according functional logic.
💣 Do not use logic trying implement a Condition Code doing code log analyses. Prone to errors adding unnecessary complexity (muda mura muri).
Building modular programs for scheduling 📚
Every program should run in a limited time (wall clock, elapsed time), logical consistent restartable. These requiement are important for predictable operations.
⚠ Not every funtional good working code is efficient good (performance) or technical good (unnecesary constraints locks).
There are many caveats. Doing the wrong choices in the engineering details it has to rebuild from scratch. A proof of concept will is not covering this.
💡 Solving all three requirements to an acceptable level as early as possible in the development process is real lean.

Data warehousing has a long history on delivering reports for decision makers. Doing machine learning is doing data processing in a different way.
The goal is to give an indication on some element. Features are descriptions associated around that element.
The ER-star diagram - predictable planned process ⚖
The previous coding guidelines, modular program, scheduling for predictable planned process still is applicable.
The processing changed to an full daily synchronisation with every 15 minutes an incremental updates (near real time)
The ER-star diagram - ML data preparation ⚖
Grouping features around an element has similarities to the star-model in dimensional modelling used for a long time.
Differences to common dwh star model are:
- Data is not complete consistent nor having complete integrity.
- More data pipelines are needed.
- Dimensions not normalised, denormalised dimensions are on topic, sufficiënt.
- When doing partial updates, what objects have been touched.
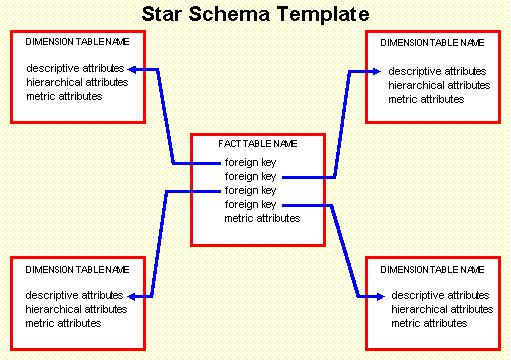
The object that is going to be scored is in a data model in the same position as the fact table in a star schema used in a dwh data model.
There are a lot of differences it is more an ER-model similar to the dwh starschema.
Building up data for data scientists for modelling is sensible. They will transform it again to something better suited for the statistical programs. That is usually a single record composed of (modified) features.
Data is not complete consistent nor having complete integrity 🎭
Doing CDC (change data capture) from a source DBMS retrieving data avoid for any lock is needed. Reading data that is updated at that moment has a weird effect:
❓ Getting features for an element in the facts that doesn'´t exist yet.
Selecting elements in facts than not all are valid
❓ to process at the moment.
With hindsight evaluating the data flow that is logical.
Surprise is learning this by analysing practical problems:
- Build working list from features, no match for that in the fact table
- Crashed run having nothing to be scored, working list not empty
- Process hang-up hitting some not expected lock in the source DBMS
More data pipelines are needed 🎭
Developing with parallel teams and the Test, Acceptance, Production lines are all needed when a model goes through the lifecycle verifying all functionality.
The scoring is becoming a part of the operational value stream.
⚠ This full lifecycle in a regular approach is not a requirement with a dwh just used for reporting dashboarding purposes.
denormalised dimensions are on topic, sufficiënt ⚙
The features , dimensions, are very good to process when it is delivered this way for the model building and model scoring. More normalisation adds waste by complexity.
⚠ In a classic dwh approach the assumptions is: you never know what the next wanted report will be. Adding complexity will create value sometime in the future.
When doing partial updates, what objects have been touched ⚙
A near real time scoring on a huge populations will run fine when only the most recent updates are scored and updated.
This is requiring defining a working list of elements in the fact table that have been updated since the last run.
💡 This near real time update for scoring and retrieval using:
- rebuild in an optimal technical storage on very regular moments
- use it for small updates, similar to an OLTP
I have never seen this done with reporting, dashboarding, based on a classic dwh.

Documenting and naming all elements that are used in data is a very basic activity of data governance.
Bypassing this in favour of technical solutions will result in too little understanding how the data flow is.
Do not start pushing the data information that is available, start at the information being requested.
Defining, naming all elements ⚖
Learning van information that is present and than asking for new inforamtion to add is a full circular appraoch. There are two questions to answer first.
- What information in what kind of data structure is the best at delivery, process output.
- What information in what kind of data structure is the best at input of the process.
The available information (input) is a fixed layout.
output, results, having a goal are in a relational format using columns.
Adding the information request for what is needed, is the new mind setting.
Conversions transformations are the manufacturing, assembly steps.
Defining, data structure process output 🎭
Delivering information in a tabular format using columns with logical names is most practical for further processing.
Choosing the columns orientation is vague. There can be multiple options. During handing over found that both options are valuable.
💡 The end result in delivery:
- Tables with columns having elements details.
Time and responsible party are variations by key values in rows.
- Tables with columns having responsible party details.
Time and elements are variations by key values in rows.
- Tables describing what elements are present split in datasets when there columns in element details.
Defining, data structure process output 🎭
💡 Storing partitioned in yearly collections for every delivery type is for archiving replacing correcting most sensible.
💡 Storing the elements in a vertical way, not the usually column orientations but transposed is giving the best flexiblity in all changes of new element types.
This was an existing sitation, only the naming an decriptions of all elements technically complicated solved.
Both approaches are not normal dwh practices. The naming definitions with text and keys to add.
Defining, naming all elements ⚙
Starting the inventarasition noticed there are lot of the same elements for a different time period. Solution in the naming convention:
- Y00 Y01 Y02 Y04 Y05 current, previous years
- F01 Future year.
- M01 M02 - - M10 M11 M12 the months of the year.
When preparing data for delivery these should go into seperate rows wiht an adjusted time indciator key value
The other one are values for other periods:
- realised (Accepted)
- expectations differences (Balance)
- Corrected total value
The simple formula to verify is: A+B=C.
Tansforming the information ⚙
⚠ Transposing data is not a normal data transforamtion. It doesn´t even exist as a standard dwh data flow.
Transposing fast and controllable the data is what is needed in this approach. Windowing functions in SQL is an option, programming in the old classic way is easy and very fast.
The main technical issues are optimising data models and the processing in an easy understandable modular approach.
At these projects I used SAS for prgramming. I am convinced it is also possible wiht other languages.
Naming conventions and standard way of work is the key issue. Not easily copied into another organisation.
Analtics in different contexts
The analytics usage, Computer System Investigations is very similar to business analytics. It got the focus on only securiyt operations as single usage goal.
Others are not getting the attention they deserve. Those are:
- System performance
- status inventory
- cost accounting
A lot room for improvements.
Maturity learning organisation, successes - failures
Even more weird is seeing the generic ETL and DWH once were in place coming back as new trends.
There is so much knowledge "how to do it" getting lost and ignored.
The best results for an local organisation are achieved when the system is build appreciating:
- local situation hardware software information context
- local naming conventions understanding context
- using generic tools hardware software building local systems
🎭 Ingonoring those local organisation only going for "using generic tools (cots)" brings hardly improvements for the local organisation.

Words of thank to my former colleagues
We had a lot fun in stressfull times working out this on the mainframe in the nineties. The uniquenes and difficulties to port it to somewhere else realising.
A few names:
Not always unhappy by what is going on

this topic ends here. back to devops sdlc
👓 🔰
Technical Implementations.
System Performance - users, groups business lines.
System performance system resources.
Assuming the system has no speed limit no interactions between system resources is giving a lot of frustrations in realisations.
Some of those are unexpectly popping up as an impossible impediment when working on solutions for an organistion.
Using standard tools to implement data flows and model scorings has dependencies on other tooling and the computer system.
Knowing what the technical environment is and what limitations there are:
- number of cpu´s, their chaching, io connections
- Speed of network connections and behavior
- Speed of storage, behavior and sizing
Decisions for technical design and coding should be a result of knowing this and understanding what the impact will be.
Some limitations will change in near future, others will get more troublesome. Duplication of data just because having a lot of involved machines complicated challenge.
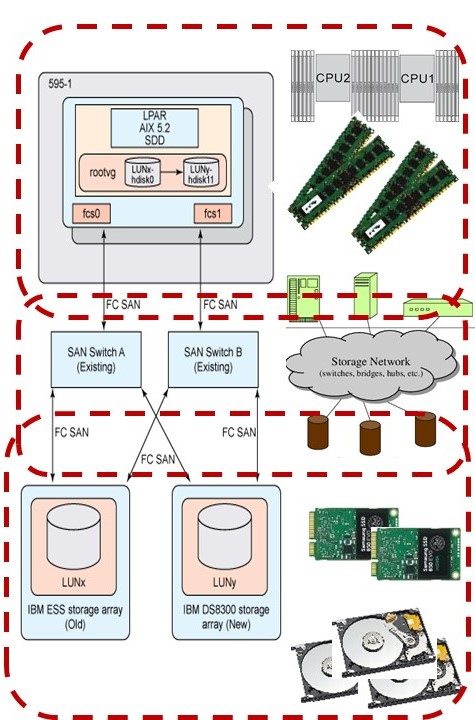
⚠ Connecting (channel adapters - strings) storage
In the 80´s the mainframe got better storage, dasd 3390. Several units of an incrediable, for that era, of 10Gb got connected. All attention was on the sizing.
We learned in the hard way that the best performance was achieved by spreading data over those four connections (striping), servicing customers (multi tenancy) by time slicing.
This tuning guideline by storage administration got well known.
⌛ ⏳
Working after 2016 on that big data low varibility ER model, got hit by performance issues.
Analysing the issue and hardware setup. Found four strings and the data not being spread (not striped). IT was sold as I0 type storage. Redundant using mirroring and striping, using four storage units on each string.
Missed was the striping because all attention went to the sizing.
What was the practical issue:
❓ Elapsed time for a process went from 10 minutes to 4 hours, same data same code.
✅ Transfersizes buffers are lookng fine (64k unit size). Alignment for files data are set. When using bulk load, bloksize transfer are big. The drop in transfer bloksize transfer is coming back analysing accessing manay files.
.
❓ Creating a test program doing modified record updates. Did run apx 20 seconds on one machine and 10 minutes on another, same data same code.
Alarming: Nobody at responsible parties reacted understanding the issue.
⚠ Caching globally (OS) or in a subsystem DBMS
In the 80´s the mainframe got IO system routines. HAving not that much internal memory the choice was in who and where caching of information was done the most effective way.
Caching in Area's and buffers at the DBMS or specfying them for a named IO stream (JCL DD-statement) worked with all control the best, avoiding system overload.
⌛ ⏳
Unix Windows in recent years got that much internal memory that they use all what is not used ba some process will use for IO-caching.
This happens without any notification or logging.
What was the practical issue:
❓ Elapsed time for a process went unexplainable up in mulitple times, same data same code when may and big datasets are processes at the same moment.
❓ Creating a test program it wsa not repeatable, only looking at the total load when the delay was experienced and also when running smoothly showed that correlation.
Calculating the size and load the system cach limit was exceeded far. Effectively overlaoding the system waiting for IO, cleaning up the cache.
💡 Decrease size and doing time slicining avoids the issue.
Alarming: Nobody at responsible parties reacted understanding the issue.
RACF, SMF System performance, system sizing.
Soc, Security operations Center and Computer Operations.
SoC in a very simplified approach only having that interface of security access.
Assuming the interface by a security tool is about access is wrong.
Menu setting, resources limits, account (cost management)
are often put in the same operational management interface.
An ancient figure of the 80´s.
Logs are shared for different goals.
IT Operations Analytis, new in big data (just before 2020).
In the fields of information technology (IT) and systems management, IT operations analytics (ITOA) is an approach or method to retrieve, analyze, and report data for IT operations.
ITOA may apply big data analytics to large datasets to produce business insights. In 2014, Gartner predicted its use might increase revenue or reduce costs.
In 2016, Gartner coined the term AIOps, which stands for "Artificial Intelligence for IT Operations", as an industry category for machine learning analytics technology that enhances IT operations.
By 2017, it predicted that 15% of enterprises will use IT operations analytics technologies. (wikipedia)
Nothing real new 🎭. The focus is on services products to sell, not on improvement of the local busisess (how do they do it?).
⚠ Memory user setting (2010), not Security.
A disappointing example of the user interface mismatch:
- Old system runs nice with a user setting of 4Mb memory. (Mainframe TSO)
- New system unexplainable crashes in a meomory violation.
Increasing to 6 and 8 Mb doesn´t help.
- Gathering information and doing analyses, asking to follow with a system monitor. The system monitor only available at some persons.
- Seeing it doesn´t go wrong at 4Mb but at 36Mb.
Remembering some notes in 24-bit adressing (16Mb).
The new challenge is to explain to operational security staff increase the setting from 4Mb to 64Mb. At the desktop the memory size was already 4Gb.
- it is only an increase from 36 (32+4) to 72 (64+8).
- Seeing it doesn&acutut go wrong at 4Mb but at 36Mb. Remembering some notes in 24-bit adressing (16Mb). History of the 90´s.
⚠ Primary group user setting (2010), not Security.
Another disappointing example of the user interface mismatch:
- The hierarchy defined by the "primary group". (Mainframe TSO)
- Using that primary group to differentiate conform hierarchical naming conventions causing problems because security staff doesn´t understand the difference between primary and secondary groups.
Using the primary group as indicator in an application makes a tool reusable by many groups. Defining an in file or registry settings are other options, those are adding complexity at the user support staff side.
⌛ ⏳
Unix is also using a Primary Group set with the user. DAC (Posix) access rights setting default for an organisation does not make sense for business applications.
Setting the groupid and sticky bit (Command: chmod 3750, 3770) is the real solution for business logic an separate the business data on folders.
The owner is able to set those and that is not by central security staff. There are some more options using the hierachical tree.
Big data low variability, ER model.
Running predictable planned processes ⚙
Planning an operational process is dictated by agreed interfaces.
Those interfaces are decoupling responsibilities needing both actions on what is the goal when all goes as intended and what when one of the deadlines in interfaces by any party is missed.
The scheduling:
- Start as early as possible 05:00u for a full load full score for area 1. (1 hour execution)
Some monthly dates this is not possible because a full system backup runs at the same moment.
- Start at 06:00u for a full load full score for area 2. (1 hour execution)
Full load s should not run at the same moment when the machine would have problems to do that.
- Start at 07:00u for a full load full score for area 3. (1 hour execution)
Area 3 is one hour off in wall clock time. Every area is finished well in time before office workers are starting.
- Start the 15 minute interval incremental updates at 08:00 till 18:00u.
⚠ Network load
The full load is causing heavy network traffic. In the setup this not isolated from end-users. Guideline: avoid that heavy traffic at office hours.
Using the same flow that is not allowed to run in multiple instances avoids data corruption. It will cause delays, stacking up flows to wait finishing previous ones.
❓ ⚠ Shameful this caused issues when a flow did crash and not cleaned up well by the commercial scheduler - load balancer.
⚠ Processing many files (vtoc catalogue - inodes)
In the 80´s the mainframe got IO system routines BDAM QSAM VSAM using catalogues where to find data and VtoC (volume table of contends) describing what is on volume.
For many small datasets a PDS / PDSE was used to avoid most of the overhead involving catalogue and vtoc maintenance.
Several experiences in the effect on open/close resulted in avoiding catalogues - vtocs administration to a limited number for performance reasons.
⌛ ⏳
Running a program using "modify data in place". It did run acceptable at the develop machine. Monitoring system resources an unexpected heavy IO load was seen.
Why that heavy load when all records are sequential processed? Then seeing the time stamps of the file are continuously updated. The block size for writes (IO) very small.
This is a programming design failure impossible to get escalated.
⌛ ⏳
Running a program using many small files in a Unix(linux) environment. With many I mean above 32.000 files in one directory, 250.000 in a directory tree.
In that case seeing all kind of performance issue on the system even going to be non-responsive.
This is an unexpected system behaviour impossible to get solved by support, only reducing load at a moment (load balancing) is possible.
⌛ ⏳
Having assumed all temporary files are redirected to well sized and performing locations than a new one popped up. In this case caused by the java run time environment default location.
This is a programming design failure impossible to get escalated.
⚠ CPU & memory load
The old idea of a single CPU with dedicated attached memory is not the stat of art anymore.
When considering a chip with multiple cores, there is a question of whether the caches should be shared or local to each core.
Implementing shared cache inevitably introduces more wiring and complexity.
But then, having one cache per chip, rather than core, greatly reduces the amount of space needed, and thus one can include a larger cache.
.. For example, an eight-core chip with three levels may include an L1 cache for each core, one intermediate L2 cache for each pair of cores, and one L3 cache shared between all cores. (wikipedia)
Just adding some CPU could nout be effective when it not sharing enough of those caches. Another challenge when running into performance, load balancing issues.
Monitoring, Logging, tuning - Service Delivery.
Well behaving Information Systems 💡
The choice to achieve an good Informations System is not by assuming the hardware / cloud will solve it.
No matter what it is about, understanding the information flow and the global impact for load on infrastrcuture is required.
There are global references at the "design data" chapter, some more technicla details are in pragrpahs here.
The bottom line is using OS, operating system, tools for monitoring system resources. Anything else is using some OS tool in a hidden way.
With a focus on having used SAS intensively:
SAS practical paper A previous SAS White Paper, "A Practical Approach to Solving Performance Problems with the SAS System," detailed the role of the FULLSTIMER option in diagnosing and solving performance problems.
It introduced the usage of host-based performance monitors for further investigation.
This paper continues with that approach, detailing the use of the most commonly available host-based performance monitors.
It will discuss how to employ them in performance testing, interpret them with a SAS mindset, and reconcile them to FULLSTIMER output to determine problem causes.
- Windows taskmanager
- Windows desktop: perfmon, requiring local admin rights
- Mainframe: RMF or equivalent, SDSF
- Unix: lsblk vmstat iostat ps, top topas nmon etc.
Short recap lean desing, data warehouse 3.0 💡
The inbound and outbound warehouse are have a simple goal:
Solving the availability for a continuous flow in other parts of a request-delivery chain.
The classic dwh concept is not according that warehouse goal when doing a lot of transformations.
E-L ➡ T
Decoupling the E (extract) and L (Load) from the T (transformation) is needed to simplify information flows.
Short recap lean desing, Initialisation Terminiation 💡
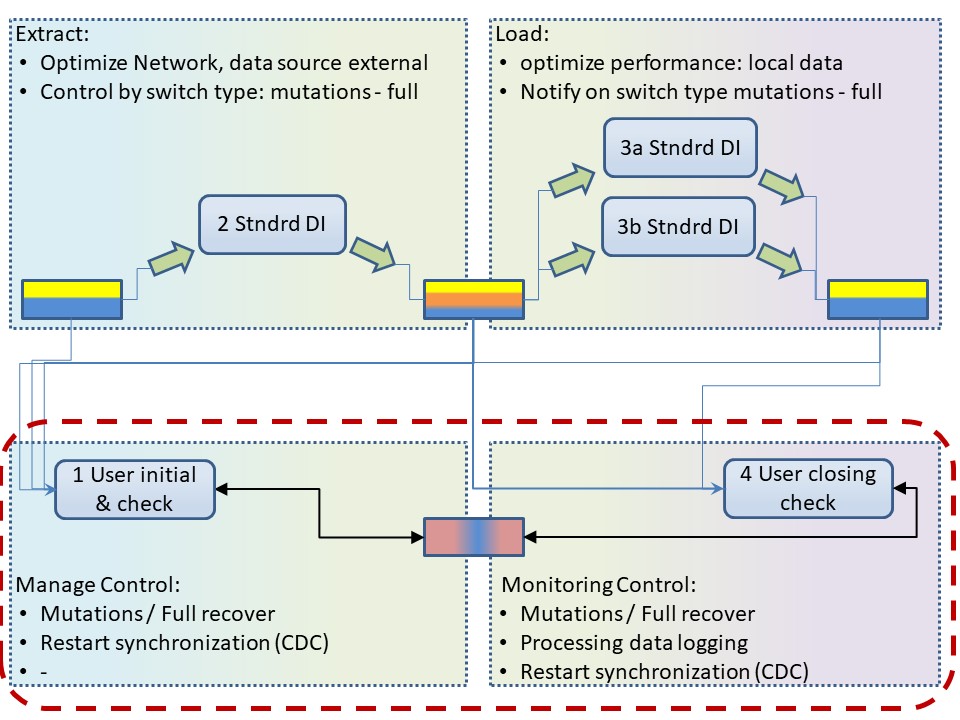
Detailed control & balance, managing the Extract & Load is requiring knowledge by an initialisation and termination logic, tailored to an organisation in house processes.
E-L ➡ T
Those control steps are impossible in a generic technical approach. Requiring non standard logic to add to generic tools classified as "econfiguration" (undervaluation of importance).
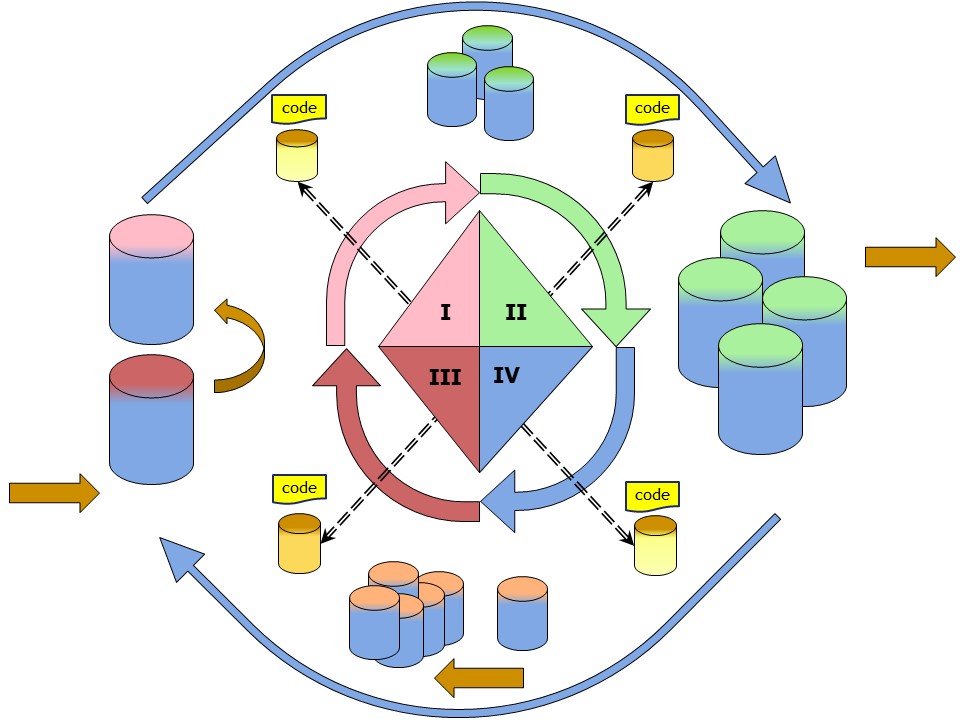
Short recap lean desing, full process design 💡
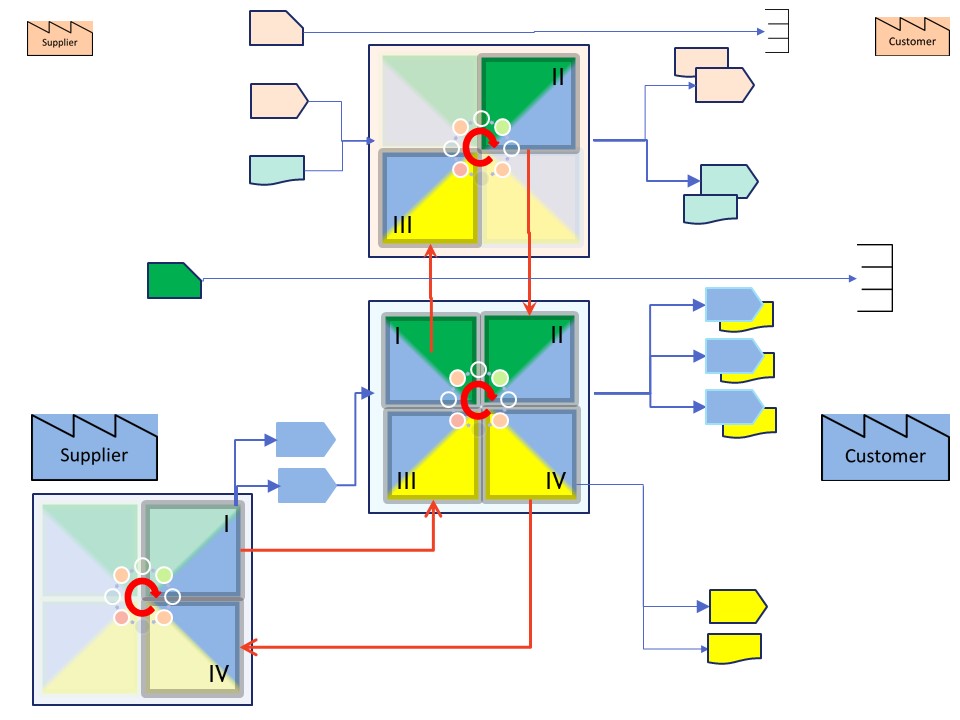
Any process whether physcial or in the cyberspace is going through a circle.
➡ request, IV ➡ III (pull)
(push) ➡ I ➡ II ➡ delivery
Two supporting processes are there for delivering the needed components and another for the uses machines.
🚧 ⚠
Changing focus from the "value stream" into using machines (tools software, cots) is a common distraction with ICT.
Importance of Naming Conventions, Data Administration 💡
Data Administration or Master Data Management (MDM), the goal is a clear understanding on the meaning context inentions and goals. When MDM is technology driven I prefer DA for human context driven.:
Gartner
Master data management (MDM) is a technology-enabled discipline in which business and IT work together to ensure the uniformity, accuracy, stewardship,
semantic consistency and accountability of the enterprise?s official shared master data assets. Master data is the consistent and uniform set of identifiers and
extended attributes that describes the core entities of the enterprise including customers, prospects, citizens, suppliers, sites, hierarchies and chart of accounts.
🚧 ⚠
The importance of a clear naming conventions with the goal of clear understanding and using that for simple technical solutions cannot be overvalued.
Dataops, datamodel, AlC type3.
Becoming data driven. agile thinking 💡
In a data driven approach there is cycle around the analist. Structuring data is mentioned but not the goal. The goal is having it automated for consumers.
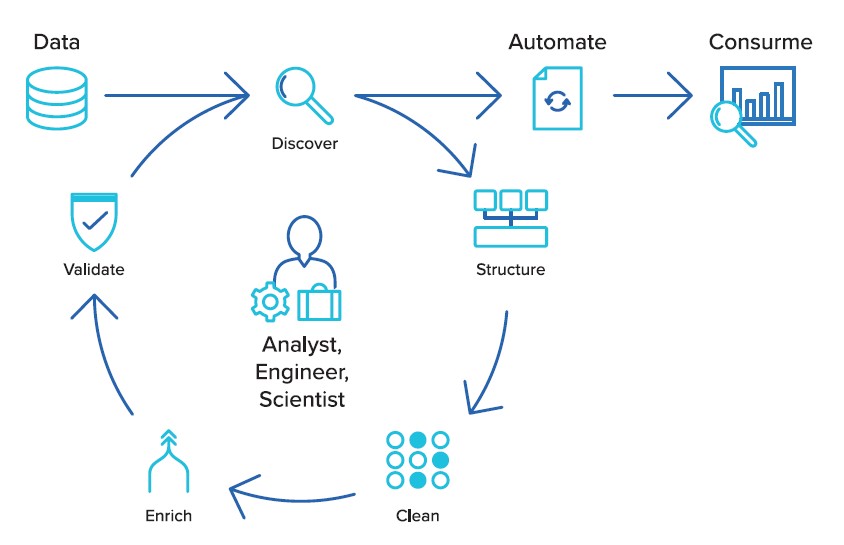
Avoiding the intermediate dwh data model can save a lot of unncessary overhead.
The used figure is from trifacta, promoting the EL - T decoupling.
Correcting information, Logical 💡
- Logical information that is incorrect but will be corrected in the source system is a temporary problem.
- Logical information that is incorrect and is creates in the dwh reporting system is a problem to solve. Options are:
- Recreate everything having the cause corrected. The orignal wrong information, wrong reports will be lost.
- Have a correction of information datasets adding negative counts and other opposite values of the wrong information.
Logical correction of information is solvable unless the interpretation of information gets fraudulent.
Presenting Mainframe cost using PC devices is possible adjusting numbers in spreadsheets, very difficult to solve as exceptions in data flows (SDDB).
Correcting information, Technical 💡
Numbers are not absolute in the real floating world. Rounding is often hidden in the technical connections by changing dtatypes. Another shift can be caused by date representations.
corrections:
- When monitoring is wanted for a target environment and rounding is on the data conversion, than: code the technical rounding when a change detections is needed.
Using SAS datasets numeric are floating, round values are formatted values. Excel is doing it in a similar way. What you see is not the real value.
- When there are calculations on a date done (temporal data) and there are also missing dates avoid overflows by using 9999 for a missing year. Adding a one to 9999 can cause an overflow in systems.
Better would be using year 9500 (499 up and down) as logical missing values avoiding NULL.
- For data calculations many tools are using a limited window, eg only after 1900 ( Excel) When using a calendar date type. A Julian or Gregorian calculation will show differences for dates beyond daily life scope.
- Blanks in character fields have an unclear logical meaning: is it logical missing or is it technical missing?
The pitfall in using SAS SQL is that this is not clearly defined. In a statistical approach it was different (logical missing) than the three value logic of SQL (NULL technical missing).
Using coding guidelines is the only possible option to avoid mistakes.
Monitoring information, Logical 💡
The information shoud be monitored on logical correctness. The technical correctness is a matter of whether some code has run.
Cross validations:
- Using totals of different information systems that should be the same.
- Setting logical limits of high - low and percentage of change for values in logical information.
- Showing exceptional (top 10) of cases that are logical different compared to other similar ones.
Because it is about monitoring logical values there are no standard technical solutions. Only technical patterns are possible to develop.
Evaluating realistions.
EOL (end of life) for ETL.
🚧 There is long history on doing ETL, delivering data marts from a special developed data warehouse using a data model that is completely different from the operational information data model.
That all started with good reasons of limited machine capacity and a forced separation from operations.
💡 It is time for a change of those old habits. Dataops is the new buzzword.
ETL vs ELT: Decoupling ETL (trifacta)
Traditional ETL might be considered a bottleneck, but that doesn´t mean it´s invaluable.
The same basic challenges that ETL tools and processes were designed to solve still exist, even if many of the surrounding factors have changed.
For example, at a fundamental level, organizations still need to extract (E) data from legacy systems and load (L) it into their data lake.
And they still need to transform (T) that data for use in analytics projects."ETL" work needs to get done but what can change is the order in which it is achieved and new technologies that can support this work.
Instead of an ETL pipeline, many organizations are taking an "ELT" approach, or decoupling data movement (extracting and loading) from data preparation (transforming).
This ELT approach follows a larger IT trend. Whereas IT architecture was historically built in monolithic silos, many organizations are decoupling the same components so that they function independently.
Decoupled technologies means less work up front (stacks don´t need to be deployed understanding all possible uses and outcomes) and more efficient maintenance.
A clean separation between data movement and data preparation also comes with its own specific benefits:
- Less friction. The person or process loading the data isn´t responsible for transforming it to spec at load time. Postponing transformation until after data is loaded creates incentive for sourcing and sharing data. It also preserves the raw fidelity of the data.
- More control. Loading data into a shared repository enables IT to manage all of an organization´s data under a single API and authorization framework. At least at the granularity of files, there is a single point of control.
- More flexibility and transparency. Information can be lost as raw data is "boiled down" for a specific use case. By contrast, untransformed data can be reused for different purposes and leaves a record for auditing and compliance.
Not always unhappy by what is going on
Doing a data pipeline as lean as possible was the way to do it. With dataops again becoming good practice.
Control at III (and IV) left side, delivery II (and I) at the right.
Working experiences by some controls. The SIAR cycle is there using the corners 👓, topic cycle in the center.
SIAR:
S Situation
I Initiatives
A Actions
R Realisations
🔰 lost here, than..
devops sdlc.